Graph theory is a branch of mathematics, first introduced in the 18th century, as a way to model a puzzle. Graphs are excellent at creating simplified, abstract models of problems. The body of graph theory allows mathematicians and computer scientists to apply many known principals, algorithms, and theories to their model.
Fundamentally, a graph is very simple. It is composed of two kinds of elements, vertices and edges (sometimes called nodes and links in computer science).
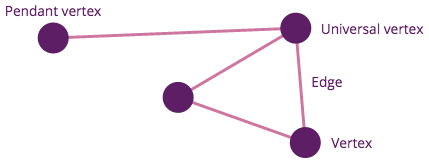
A simple 4-node, undirected graph.
Let’s look at using graph theory to quickly solve a problem. Suppose I run a sports league, with 7 teams. I want each of those teams to play exactly 3 games - is this possible? It’s not, and I can use graph theory to prove it.
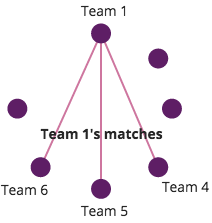
An incomplete graph of our league, showing the matches that Team 1 would play.
Let G be a graph, with 7 vertices. Let each vertex represent a team, and let each edge represent a game between teams. There is a principal, known sometimes as “the handshake lemma”, which states that a graph must have an even number of vertices that have an odd number of edges (normally phrased as odd degree). This is a consequence of the logical fact that every edge must connect to two vertices - one on each end. As we have an odd number of vertices, and each of those vertices has an odd number of edges, the total degree of the graph is 21 (AKA 7*3). In any graph, number of edges must be half the total degree, but 21 is odd, which means this graph can’t exist. As it can’t exist, we know that such a tournament bracket can’t either.
We can use graphs to effectively look up relationships or paths between arbitrary elements. A common use case is to find an optimum path between two points, given some kind of cost parameters. A simple but fun example of using this in practice was a “snake AI” that I built with some friends and coworkers.
Graphs allow us to build complex, intuitive relationships between data points. Unlike many traditional methods of structuring data, which focus on the format of relationships, graphs focus on the topology of relationships in the dataset.
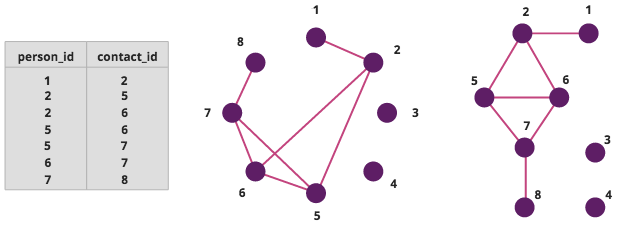
A table, the same table as a graph, and a re-oriented version of that graph.
This may look somewhat simple, but the terminology, classifications, and analytics of graphs can quickly get hairy. Let’s take a look deeper into graph theory and graph modeling.
Graph Terminology
Graph theory, like any topic, has many specific terms for aspects of a graph. First, we should probably take a quick drive past set theory and graph elements, which is important when talking about groups of vertices or edges.
Typical notations:
- G: a graph. This letter varies, such as when discussing 2 graphs, we might say G and H, or G¹ and G².
- V(G): the set of all vertices in the graph.
- E(G): the set of all edges in the graph.
- |X|: the number of elements in X. For example, |E(G)| = “the number of edges in G”.
Key terms:
- Order: The number of vertices in a graph. The order is equal to |V(G)|.
- Adjacent: A vertex v is adjacent to a vertex u IFF (if and only if) there is an edge from v to u.
- Connected: Two vertices u and v are connected IFF there exists a sequence of consecutively adjacent vertices, starting with u and ending with v. That is, you can follow an edge from u and eventually reach v.
- Degree: A vertex v’s degree is the number of edges incident to v. Notated as d(v).
Representing Graphs in Code
Before we get too deep into graph theory or problems, let’s look at the basics of programming using the graph data structure. There are a few ways to represent graphs in our programs - we’ll look at the most common three, and the basic tradeoffs.
Each of these methods has its own strengths and weaknesses. Like with any data structure, you should pick your implementation based on the way(s) that you plan on querying the data, and the expected “shape” of the data. In particular, the edge:vertex ratio and the degree of the highest-degree vertices tend to be common metrics.
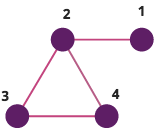
Example graph. The following 3 methods represent this graph in different ways.
Edge Lists
Edge lists are an extremely simple way to represent a graph.
They are simply composed of… a list of edges, often just in the form of [source, destination] vertex pairs.
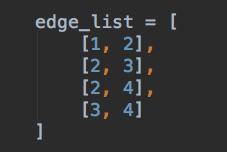
An edge list assignment in Python.
This is well suited to performant lookups of an edge, or listing all edges, but is slow with many other query types. For example, to find all vertices adjacent to a given vertex, every edge must be examined.
Adjacency Matrix
An adjacency matrix is a two-dimensional matrix, with the graph’s vertices as rows and columns. A given intersection is true if those vertices are adjacent, or false if they are not (note: if the graph is directed, be sure to define that relationship in rows vs columns).
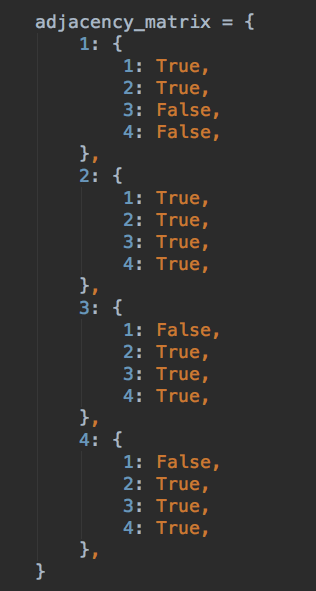
An adjacency matrix (well, a dictionary) assignment in Python.
Adjacency matrices perform strongly with edge lookups, with a constant-time lookup given a pair of vertex IDs. They tend to be slow for other operations - for example, listing everything adjacent to a vertex requires checking every single vertex in the graph.
They also typically require more space than other models, especially with sparse graphs (graphs with “few” edges). An adjacency matrix needs to reference every vertex against every other vertex, giving O(|V(G)|) space needed.
Adjacency Lists
This method has a list, for every vertex, of every element adjacent to that vertex. It bears resemblance to both edge lists, and adjacency matrices.
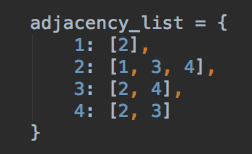
An adjacency list assignment in Python, using dictionaries.
It allows for constant-time lookup of adjacent vertices, which is useful in many query and pathfinding scenarios. It is slower for edge lookups, as the whole list of vertices adjacent to u must be examined for v, in order to find edge uv.
This typically uses far less space than an adjacency matrix (as it doesn’t need to track edges that don’t exist), but it can get just as big in a graph with many edges.
Adjacency lists are the typical choice for “general purpose” use, though edge lists or adjacency matrices have their own strengths, which may match a specific use case.
Abstractions
Abstracting graph access is vital if your graph is going to span more than a single function call. As in any programming context, over-exposing internals leads to over-reliance on knowing the internals, across scopes in the codebase… which leads to slow development, and a lot of bugs.
You can also come up with your own bugs… ahem, tricks, to optimize intended use cases. For example, if you need to list all edges, consider maintaining a separate internal list, rather than iterating over all vertices.
There are many libraries that you can use, such as gonum in Go, or networkx in Python, to use pre-built abstractions. However, writing a does-everything abstraction is hard, and I regularly curse random design choices of such libraries. I’d suggest writing your own graph structure/algorithm if you need to solve very specific/limited problems.